
"Digital marketing isn't guesswork, but sometimes it sure feels like it is."
That’s how our new client opened the discovery call with us recently. They began to explain; their web traffic was in freefall, despite significantly increasing their paid ad budget and stepping up their SEO efforts over the last few months — actions that should theoretically boost traffic.
Something seemed wrong, but no one could tell them what it was.
If you’ve been a marketer for long enough, then this might feel like a familiar situation. In this article, we’ll look into this client’s experience, what kind of data we looked at to find the solution, and how we identified what was missing from their reporting.
Background
The in-house marketing team for this client first started noticing a monthly traffic decline in September 2022. In August of the same year, the number of website visits stood at 5764, but by December, the website received just 795 website visits – a catastrophic 86.2% decline. When the client brought in the Nouvel Âge Media team on this issue in March 2023, these figures had leveled off at a measly 500 – 600 monthly visits.
On the surface, there were no obvious reasons for the decline. In fact, 2022 saw an increase in web-focused activity which should have correlated with web visits. Q1 saw the beginning of an SEO campaign to improve organic reach, plus the in-house marketing team had given the go-ahead to increase the monthly PPC budget to drive paid traffic. So, what was going on?
On the surface, there were no obvious reasons for the decline. In fact, 2022 saw an increase in web-focused activity which should have correlated with web visits. Q1 saw the beginning of an SEO campaign to improve organic reach, plus the in-house marketing team had given the go-ahead to increase the monthly PPC budget to drive paid traffic. So, what was going on?
Our Approach
It was time to drill down into the data.
First, we stated the problem in a brief report (it’s surprising how framing the problem this way generates insights).
Then, we consulted our in-house team of SMEs, who posited a couple of hypotheses. Finally, we analyzed and collated the different data channels we had available. Bringing all this together, we were able to work through our hypotheses and see which stuck. The data sources we chose included the website itself, the client’s marketing metrics tracker, and Google Universal Analytics (GUA). It’s important to note here that we extrapolated the data used in our analysis from Year on Year datasets, as opposed to simply the previous reporting period. This was critical, as the two datasets separately told slightly different stories. It was by drilling down into these differences that we were able to decipher the issue.
As for our hypotheses, our team members had a few different ideas:
Hypothesis 1: A Change in the Algorithm
The first, and perhaps most obvious, hypothesis was that there was something wrong with the site’s optimization for search engines. Following the intense SEO campaign, our SMEs suggested that frequent changes to the site and the addition of multiple new content pieces were creating issues with technical or on-page optimization. Perhaps, for instance, the client’s website was not indexing because Google may have penalized it for a violation. We investigated.
In fact, there were no indexing errors displayed on Google Analytics, and the SEO data provided suggested that the client’s site had actually increased its position in the SERP rankings during the campaign, suggesting organic traffic should have increased. On top of this, the client was not in violation of any Google Webmaster guidelines and Search Console confirmed no issues or violations. We invited a technical expert just to make sure, but they too could find no technical problems with the site. Seems like the SEO was in the clear.
In fact, there were no indexing errors displayed on Google Analytics, and the SEO data provided suggested that the client’s site had actually increased its position in the SERP rankings during the campaign, suggesting organic traffic should have increased. On top of this, the client was not in violation of any Google Webmaster guidelines and Search Console confirmed no issues or violations. We invited a technical expert just to make sure, but they too could find no technical problems with the site. Seems like the SEO was in the clear.
Hypothesis 2: Technical Setup
Perhaps, then, the data itself we were using had an error. Our second hypothesis is that GA4 was not reporting accurately due to an installation issue that needs to be fixed.
This did turn out to be partially true. Following a deep dive, our team was able to identify a few issues with conversion tracking on GA4. Unfortunately, the client’s previous ads agency hadn’t set the goals and triggers up correctly, meaning not all downloads were being tracked throughout the site.
Ultimately, however, this hypothesis was not the cause of huge discrepancies in actual vs captured traffic – i.e. this technical setup issue couldn’t be to blame for the consistent downward trend over time. Although website visits were trending downwards, other key figures showed the opposite: Average Session Duration and Engagement Rate figures demonstrated increases in activity – unlikely to have been picked up if there were a technical error limiting reporting.
Hypothesis 3: Poor Paid Ad Strategy
Our third hypothesis posited that the decrease in traffic was due to problems in the clients’ paid ad strategy. This could have been due to increased keyword competition, poor ad performance, limited CTR, or a huge range of other factors. We delved into the data.
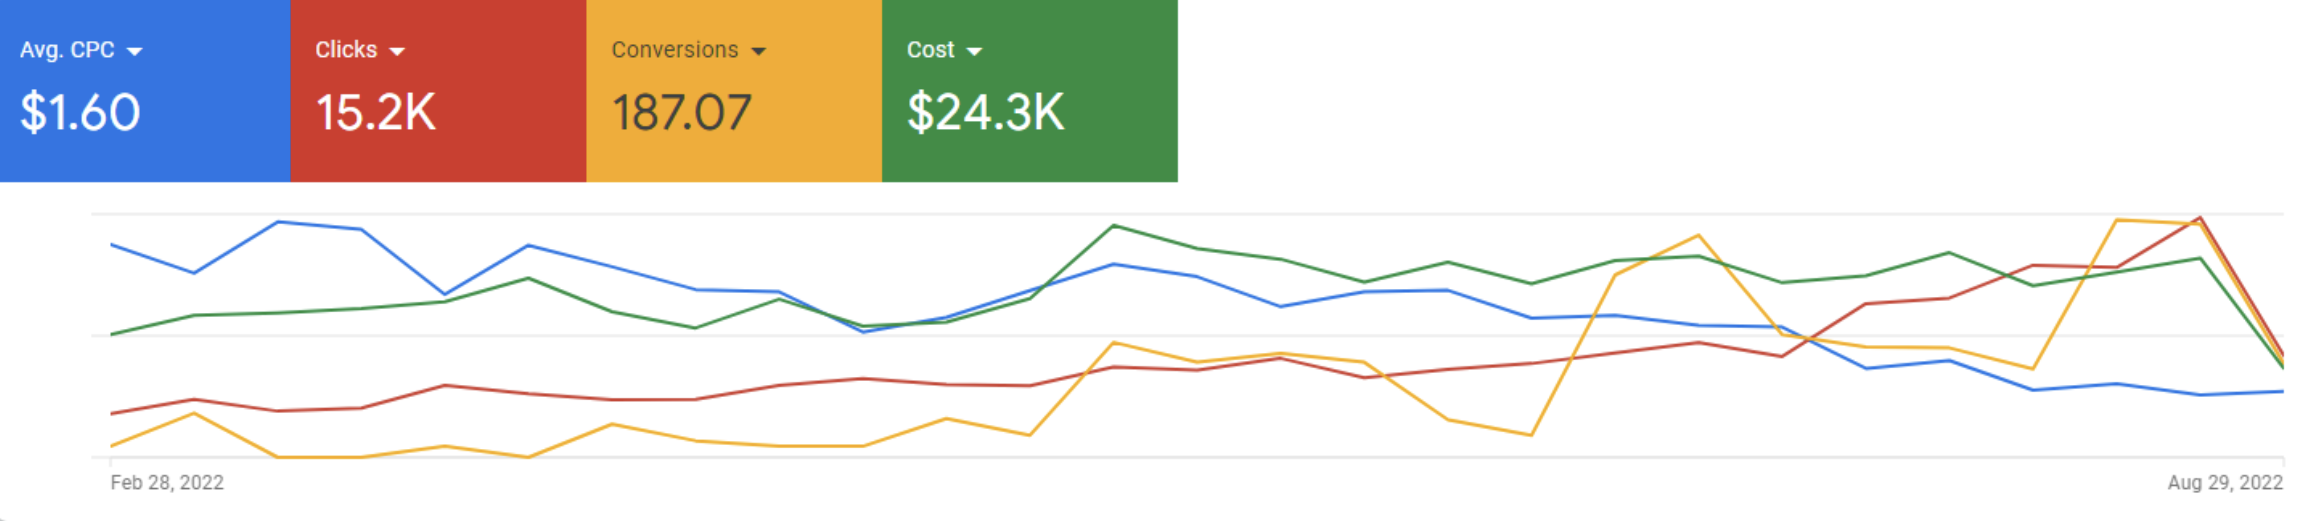
Despite the $5K change in budget, which came at the end of Q4 2022, we ultimately found no major changes or issues that would cause traffic to decline. Moreover, the client on our advice optimized their LinkedIn Advertising strategy, improved targeting on LinkedIn and Google, and launched a series of new campaigns to drive traffic and conversions. This was paying off — the data showed a huge increase in clicks and conversions that correlated with the increase in ad spend.
Despite the $5K change in budget, which came at the end of Q4 2022, we ultimately found no major changes or issues that would cause traffic to decline. Moreover, the client on our advice optimized their LinkedIn Advertising strategy, improved targeting on LinkedIn and Google, and launched a series of new campaigns to drive traffic and conversions. This was paying off — the data showed a huge increase in clicks and conversions that correlated with the increase in ad spend.
Mar 1, 2022-Aug 31, 2022
Sep 1, 2022-April 24, 2023
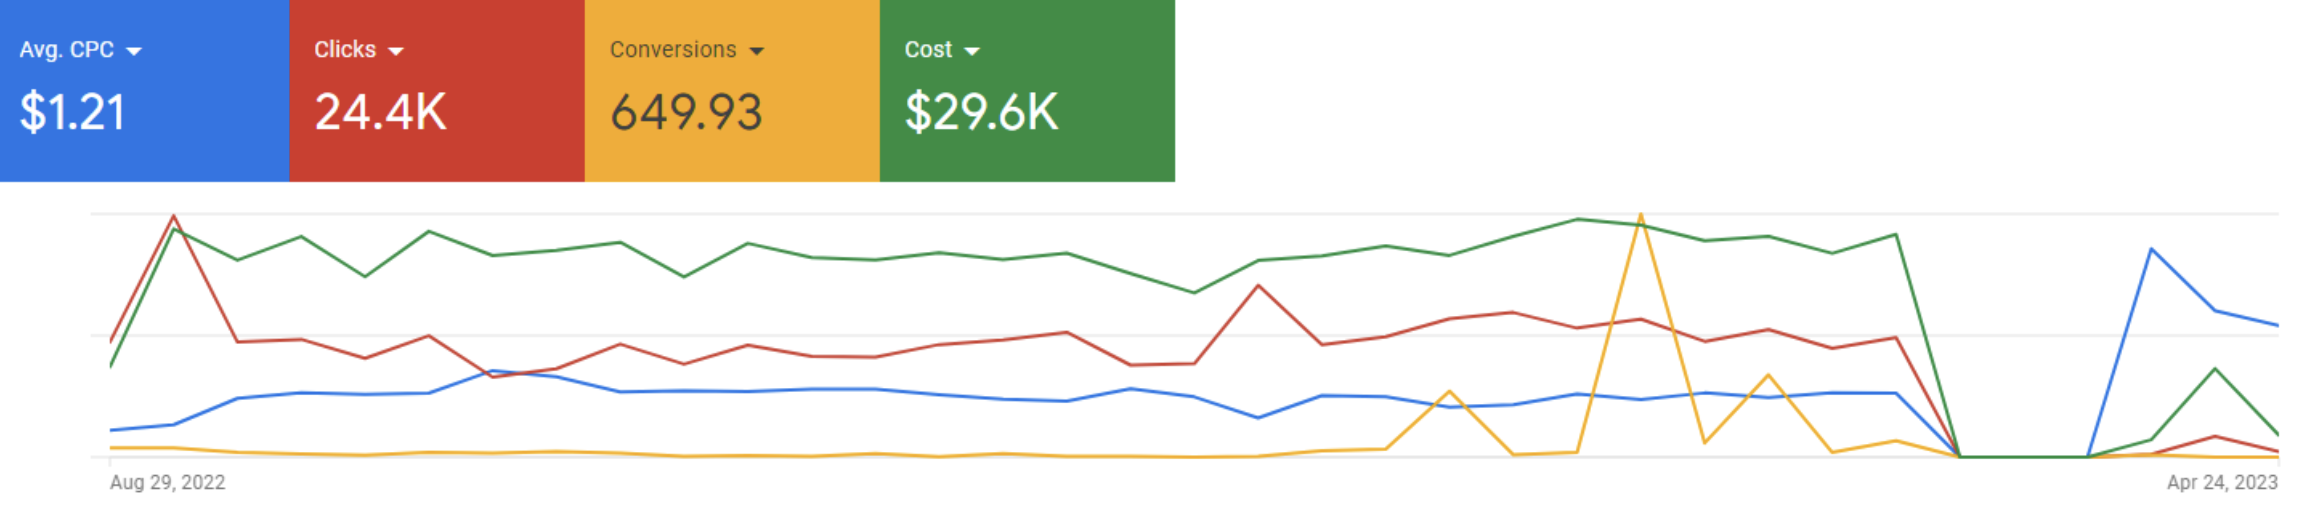
Images 1 & 2: A screenshot of the client’s paid ad data from the period of Mar 1-Aug 31, 2022, then September 1, 2022- April 24, 2023. The data shows an increase in clicks, conversions, and spend, with a decrease in cost per click over time.
Hypothesis 4: The Current Market Environment
So, could this decrease in traffic have resulted from a change in the overall market environment? Was there something else impacting demand for this client’s products?
Ultimately, we concluded that there was not. Although this client’s business was acutely impacted by the Covid-19 pandemic, in the period from September 2022 onwards, the drastic industry impacts of the pandemic were in the past. In addition, there was limited evidence to suggest that the market was generally in decline, not least because the client’s sales statistics at this time were fantastic.
Ultimately, we concluded that there was not. Although this client’s business was acutely impacted by the Covid-19 pandemic, in the period from September 2022 onwards, the drastic industry impacts of the pandemic were in the past. In addition, there was limited evidence to suggest that the market was generally in decline, not least because the client’s sales statistics at this time were fantastic.
Our Conclusion
Our conclusion might surprise you.
We found that the decrease in the volume of traffic was due to their improved targeting that focused on quality traffic over volume.
In other words, the problem the client was facing? Their strategy was working!
Overall, the client was seeing a huge increase in the quality of traffic, despite the decrease in volume. This was reflected in arguably the most important figure of them all; their marketing-driven revenue was exceeding their target for this time of year. Conversions were up, previous visitors were returning, and their average session duration had increased by 59.69%.
Although it was concerning to see visits drop that fast, in fact, those numbers demonstrated that their marketing strategy was on the right track.
Key Takeaways
Our key takeaway? In digital marketing, eyeballs on the screen don’t necessarily equate to conversions.
Although it’s great to watch numbers climb, getting clicks and visits shouldn’t be your key objective. Quality traffic is always better than quantities of traffic, yet increasingly digital marketers are asked to prioritize them both.
Ultimately, digital marketing experts won’t stand for that. Their job is to help you sift through quantity to find the quality. That’s where the best ad strategies come from, and that’s always what we prioritize at Nouvel Âge Media.
To work with us, book a call with our founder here.